
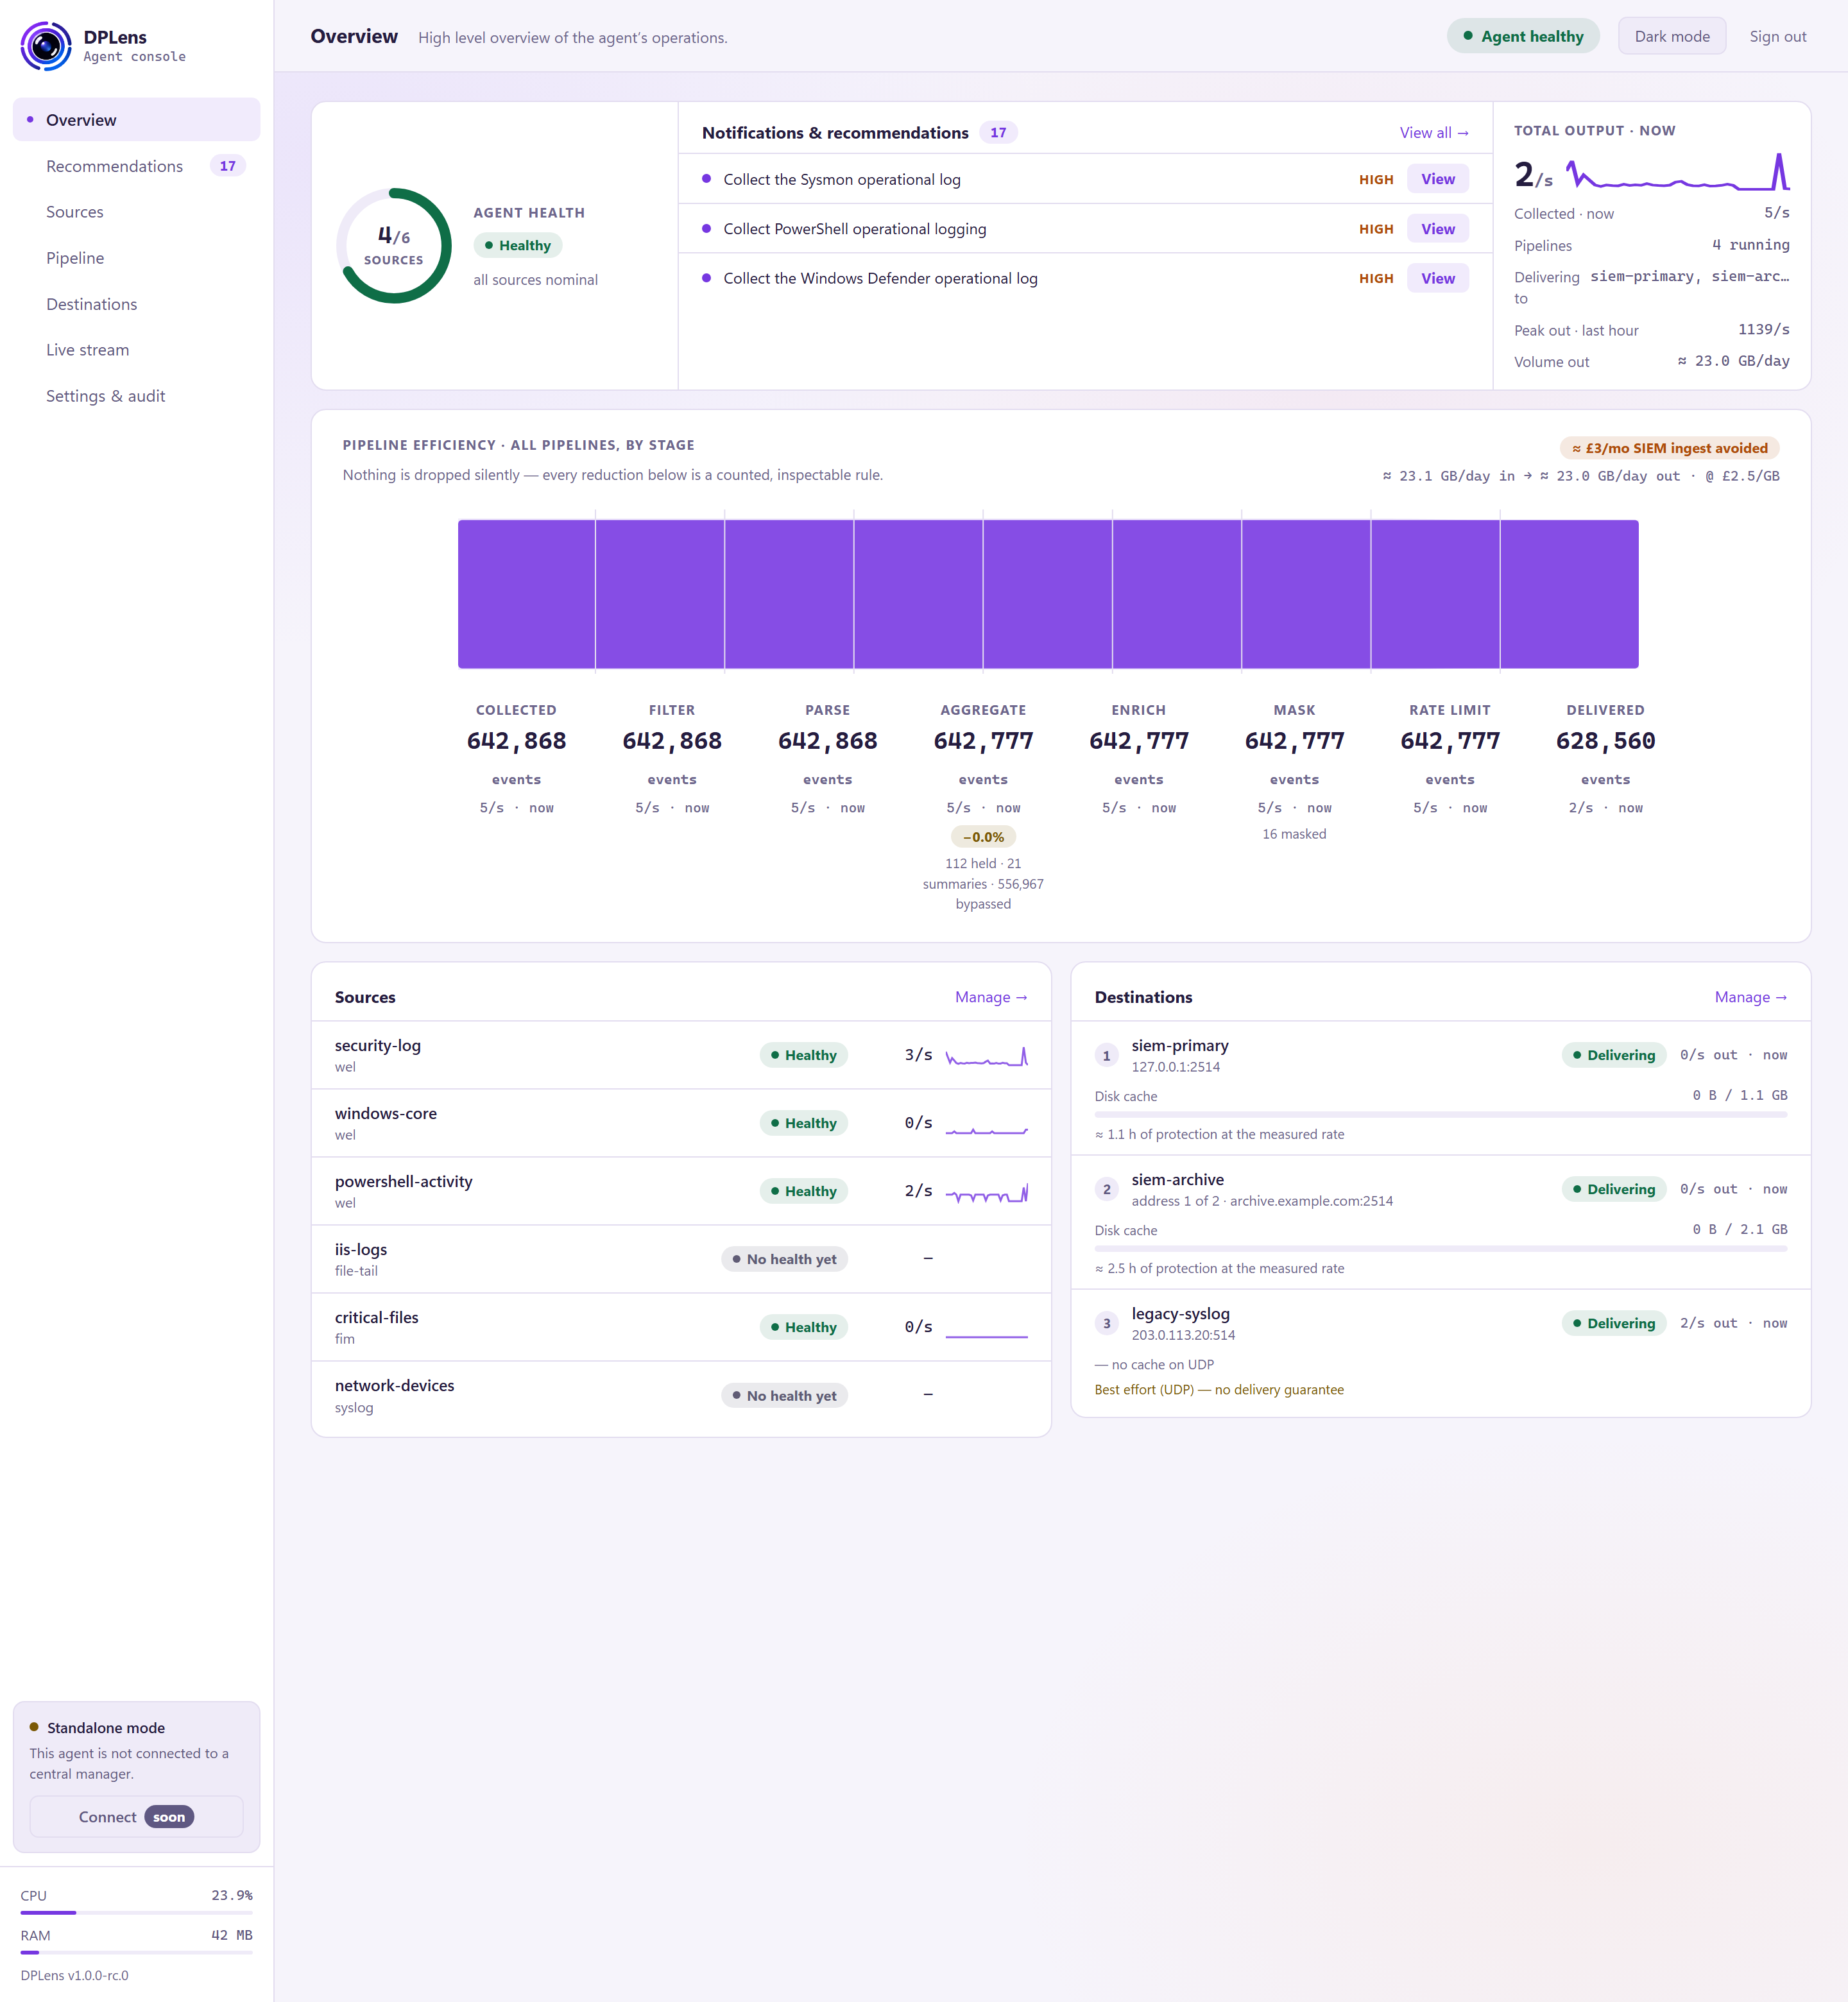
The Overview page answers one question: is this agent doing what I asked, and what is it costing me? It is entirely read-only — nothing on it changes your configuration.
Getting started
On a new installation the page opens with a short checklist — create an administrator account, review the recommendations, add a destination, watch events flow — with buttons that take you to each step. It disappears once you have events moving.
Agent health
A ring showing how many of your sources are healthy, with a one-line verdict.
Click the health indicator in the header for the breakdown: which component is unhealthy, and why.
| State | Meaning |
|---|---|
| Healthy | Collecting and delivering normally |
| Degraded | Something is not working, but the agent is still running |
| Restarting | A component failed and is being restarted |
| Quarantined | A component failed repeatedly and has been stopped so it cannot affect the rest |
A quarantined component is isolated deliberately: one badly-configured source cannot take the agent down with it.
Total output
The live picture of what is leaving this machine.
| Collected · now | Events a second arriving from all sources |
| Pipelines | How many are running, and how many are paused |
| Delivering to | Which destinations are receiving |
| Peak out · last hour | The busiest second in the last hour |
| Volume out | Estimated gigabytes a day at the current rate |
Pipeline efficiency
The funnel: how many events entered each stage and how many came out, across every pipeline.
Its purpose is stated on the card itself — nothing is dropped silently. Every reduction you see is a rule you wrote, and every event removed is counted. Where a stage shows fewer events out than in, that difference is attributable: a filter rule, an aggregation window, a rate-limit decision.
The stages are the same six you configure on the Pipeline page, plus Collected at the front and Delivered at the end.
Under the Aggregate stage you may see extra counts — how many events are held in an open window, how many summaries have been emitted, and how many events bypassed aggregation because they did not match its condition.
What it is worth
If you have set a cost per gigabyte in Settings, the card also shows what the reduction saves at that rate — gigabytes a day in, gigabytes a day out, and the difference in money.
If you have not set one, the card offers a link to do so.
Notifications and recommendations
A feed combining anything the agent wants to tell you with the suggestions from the Recommendations page. Each has a View button.
Sources and destinations
Two summary lists at the foot of the page, with a Manage → link to the full page for each.
Each source shows its health and its current rate. Each destination shows its delivery state, its rate, and how much is queued on disk.
Collection coverage and resume state
Two lines that are easy to miss and worth understanding:
- Collection coverage — how much of what you asked for is actually being collected. If a channel is empty, or a file path matches nothing, this is where it shows.
- Resume state — whether the agent resumed from where it left off. After a restart or an upgrade, DPLens continues from its recorded position rather than re-reading or skipping.
Losses
Where anything has been dropped, it is broken down by cause, with counts. For a NetFlow receiver this includes decode failures and records that arrived before their template did.
If a number here is not zero, it is telling you something specific — see Troubleshooting.